
Title
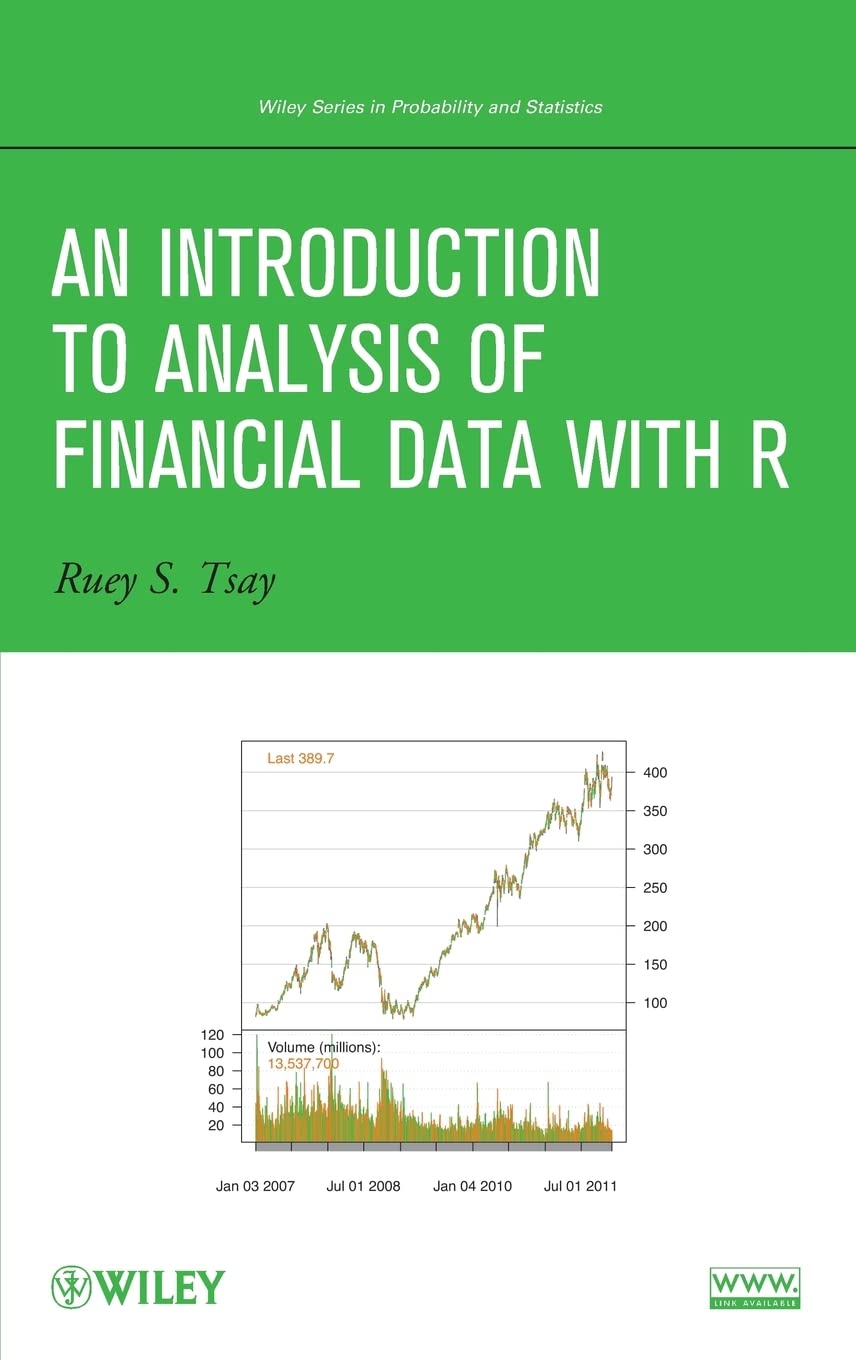
An Introduction to Analysis of Financial Data with R,New
Sold by Ergodebooks, an authorized reseller.
Returns accepted within 30 days | support@ergodebooks.com
Shipping Information
- Free Standard Shipping — United States only
- Processing Time: 3–5 business days
- Estimated Delivery: 6–10 business days after dispatch
- Double-boxed, fully insured & discreetly packaged
- Tracking number sent via email once dispatched
Returns & Refund
Returns accepted within 30 days of delivery.
Damaged or Defective Item
Free return shipping + replacement or full refund
Wrong Item Received
Free return shipping + replacement or full refund
Change of Mind
Return shipping at customer's expense · 25% restocking fee applies
Payment Option

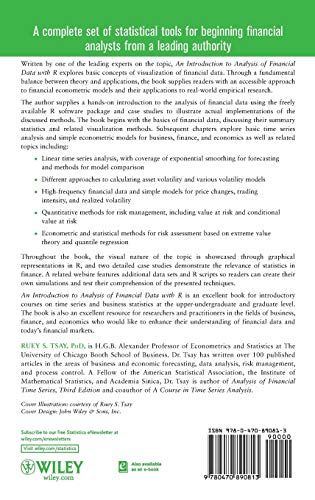
A complete set of statistical tools for beginning financial analysts from a leading authorityWritten by one of the leading experts on the topic, An Introduction to Analysis of Financial Data with R explores basic concepts of visualization of financial data. Through a fundamental balance between theory and applications, the book supplies readers with an accessible approach to financial econometric models and their applications to realworld empirical research.The author supplies a handson introduction to the analysis of financial data using the freely available R software package and case studies to illustrate actual implementations of the discussed methods. The book begins with the basics of financial data, discussing their summary statistics and related visualization methods. Subsequent chapters explore basic time series analysis and simple econometric models for business, finance, and economics as well as related topics including: Linear time series analysis, with coverage of exponential smoothing for forecasting and methods for model comparison Different approaches to calculating asset volatility and various volatility models Highfrequency financial data and simple models for price changes, trading intensity, and realized volatility Quantitative methods for risk management, including value at risk and conditional value at risk Econometric and statistical methods for risk assessment based on extreme value theory and quantile regressionThroughout the book, the visual nature of the topic is showcased through graphical representations in R, and two detailed case studies demonstrate the relevance of statistics in finance. A related website features additional data sets and R scripts so readers can create their own simulations and test their comprehension of the presented techniques.An Introduction to Analysis of Financial Data with R is an excellent book for introductory courses on time series and business statistics at the upperundergraduate and graduate level. The book is also an excellent resource for researchers and practitioners in the fields of business, finance, and economics who would like to enhance their understanding of financial data and today's financial markets.
⚠️ WARNING (California Proposition 65):
This product may contain chemicals known to the State of California to cause cancer, birth defects, or other reproductive harm.
For more information, please visit www.P65Warnings.ca.gov.
- Q: What is the main focus of 'An Introduction to Analysis of Financial Data with R'? A: The book focuses on providing a comprehensive introduction to the analysis of financial data using the R programming language, covering basic concepts of visualization, time series analysis, and econometric models.
- Q: Who is the author of this book? A: The author of 'An Introduction to Analysis of Financial Data with R' is Ruey S. Tsay, a leading expert in the field of financial data analysis.
- Q: What topics are covered in this book? A: The book covers various topics including linear time series analysis, asset volatility models, high-frequency financial data, quantitative risk management methods, and econometric methods for risk assessment.
- Q: Is this book suitable for beginners in financial analysis? A: Yes, the book is designed for beginners and provides a hands-on approach to analyzing financial data, making it accessible for new financial analysts.
- Q: How many pages does the book have? A: The book contains 416 pages, providing an in-depth exploration of financial data analysis.
- Q: What type of binding does the book have? A: The book is available in hardcover binding, which offers durability and a professional appearance.
- Q: When was 'An Introduction to Analysis of Financial Data with R' published? A: The book was published on October 29, 2012.
- Q: Are there any practical applications included in the book? A: Yes, the book includes case studies that illustrate the practical applications of the statistical methods discussed, along with R scripts for creating simulations.
- Q: Is there additional online content available for this book? A: Yes, there is a related website that features additional datasets and R scripts to help readers practice and enhance their understanding of the techniques presented in the book.
- Q: What is the target audience for this book? A: The book is targeted at upper-undergraduate and graduate students in introductory courses on time series and business statistics, as well as researchers and practitioners in business, finance, and economics.