

Title
Data at Work: Best practices for creating effective charts and information graphics in Microsoft Excel (Voices That Matter),Used
Sold by Ergodebooks, an authorized reseller.
Returns accepted within 30 days | support@ergodebooks.com
Shipping Information
- Free Standard Shipping — United States only
- Processing Time: 3–5 business days
- Estimated Delivery: 6–10 business days after dispatch
- Double-boxed, fully insured & discreetly packaged
- Tracking number sent via email once dispatched
Returns & Refund
Returns accepted within 30 days of delivery.
Damaged or Defective Item
Free return shipping + replacement or full refund
Wrong Item Received
Free return shipping + replacement or full refund
Change of Mind
Return shipping at customer's expense · 25% restocking fee applies
Payment Option

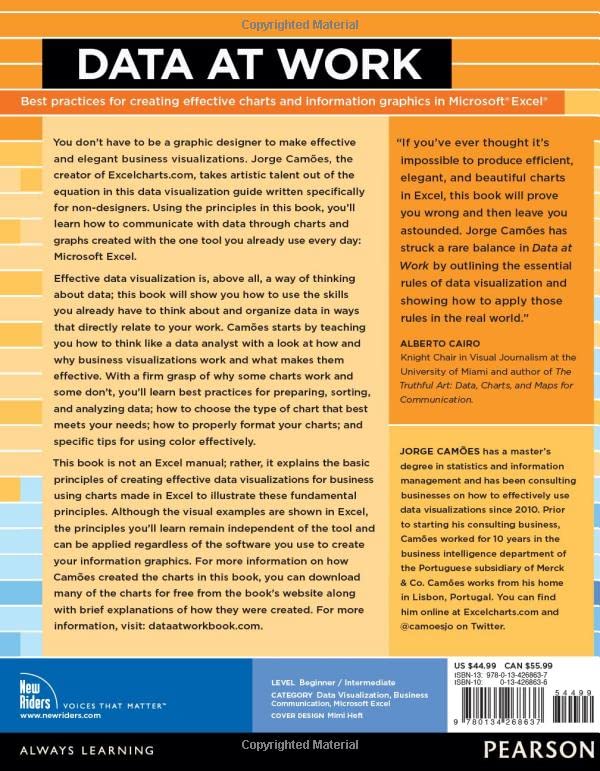
Information visualization is a language. Like any language, it can be used for multiple purposes. A poem, a novel, and an essay all share the same language, but each one has its own set of rules. The same is true with information visualization: a product manager, statistician, and graphic designer each approach visualization from different perspectives.Data at Work was written with you, the spreadsheet user, in mind. This book will teach you how to think about and organize data in ways that directly relate to your work, using the skills you already have. In other words, you dont need to be a graphic designer to create functional, elegant charts: this book will show you how.Although all of the examples in this book were created in Microsoft Excel, this is not a book about how to use Excel. Data at Work will help you to know which type of chart to use and how to format it, regardless of which spreadsheet application you use and whether or not you have any design experience. In this book, youll learn how to extract, clean, and transform data; sort data points to identify patterns and detect outliers; and understand how and when to use a variety of data visualizations including bar charts, slope charts, strip charts, scatter plots, bubble charts, boxplots, and more.Because this book is not a manual, it never specifies the steps required to make a chart, but the relevant charts will be available online for you to download, with brief explanations of how they were created.
⚠️ WARNING (California Proposition 65):
This product may contain chemicals known to the State of California to cause cancer, birth defects, or other reproductive harm.
For more information, please visit www.P65Warnings.ca.gov.
- Q: How many pages does this book have? A: This book has four hundred forty-eight pages. It provides comprehensive insights into effective data visualization techniques.
- Q: What type of binding does this book have? A: This book features a paperback binding. It is designed for easy handling and portability.
- Q: Who is the author of this book? A: The author of this book is Jorge Camões. He is known for his expertise in information visualization.
- Q: What topics does this book cover? A: This book covers best practices for creating charts and information graphics. It is tailored for users who work with data in spreadsheets.
- Q: Is this book suitable for beginners? A: Yes, this book is suitable for beginners. It teaches fundamental concepts of data organization and visualization without requiring prior design experience.
- Q: Can I use this book with any spreadsheet application? A: Yes, you can use this book with any spreadsheet application. Although examples are in Microsoft Excel, the techniques are universally applicable.
- Q: How do I download chart examples from this book? A: You can download chart examples from the book's accompanying website. Brief explanations of how each chart was created are provided.
- Q: Is this book appropriate for professional use? A: Yes, this book is appropriate for professional use. It offers insights that are valuable to product managers, statisticians, and graphic designers.
- Q: What is the main focus of this book? A: The main focus of this book is on effective information visualization. It teaches how to think about and organize data for clarity.
- Q: How should I care for this book? A: To care for this book, keep it in a dry, cool place and avoid exposure to direct sunlight. This will help preserve its condition.
- Q: Are there any safety concerns with this book? A: No, there are no safety concerns with this book. It is a standard printed book without any hazardous materials.
- Q: What if I receive a damaged copy of the book? A: If you receive a damaged copy of the book, you should contact customer service for a replacement. Most retailers have return policies in place.
- Q: Is this book helpful for creating charts in Excel? A: Yes, this book is helpful for creating charts in Excel. It provides guidance on selecting the right type of chart and formatting it effectively.
- Q: What kind of charts does this book discuss? A: This book discusses a variety of charts, including bar charts, scatter plots, and bubble charts. It helps users understand when to use each type.
- Q: Can I learn data visualization techniques from this book? A: Yes, you can learn data visualization techniques from this book. It focuses on practical skills that you can apply to your work.