
Title
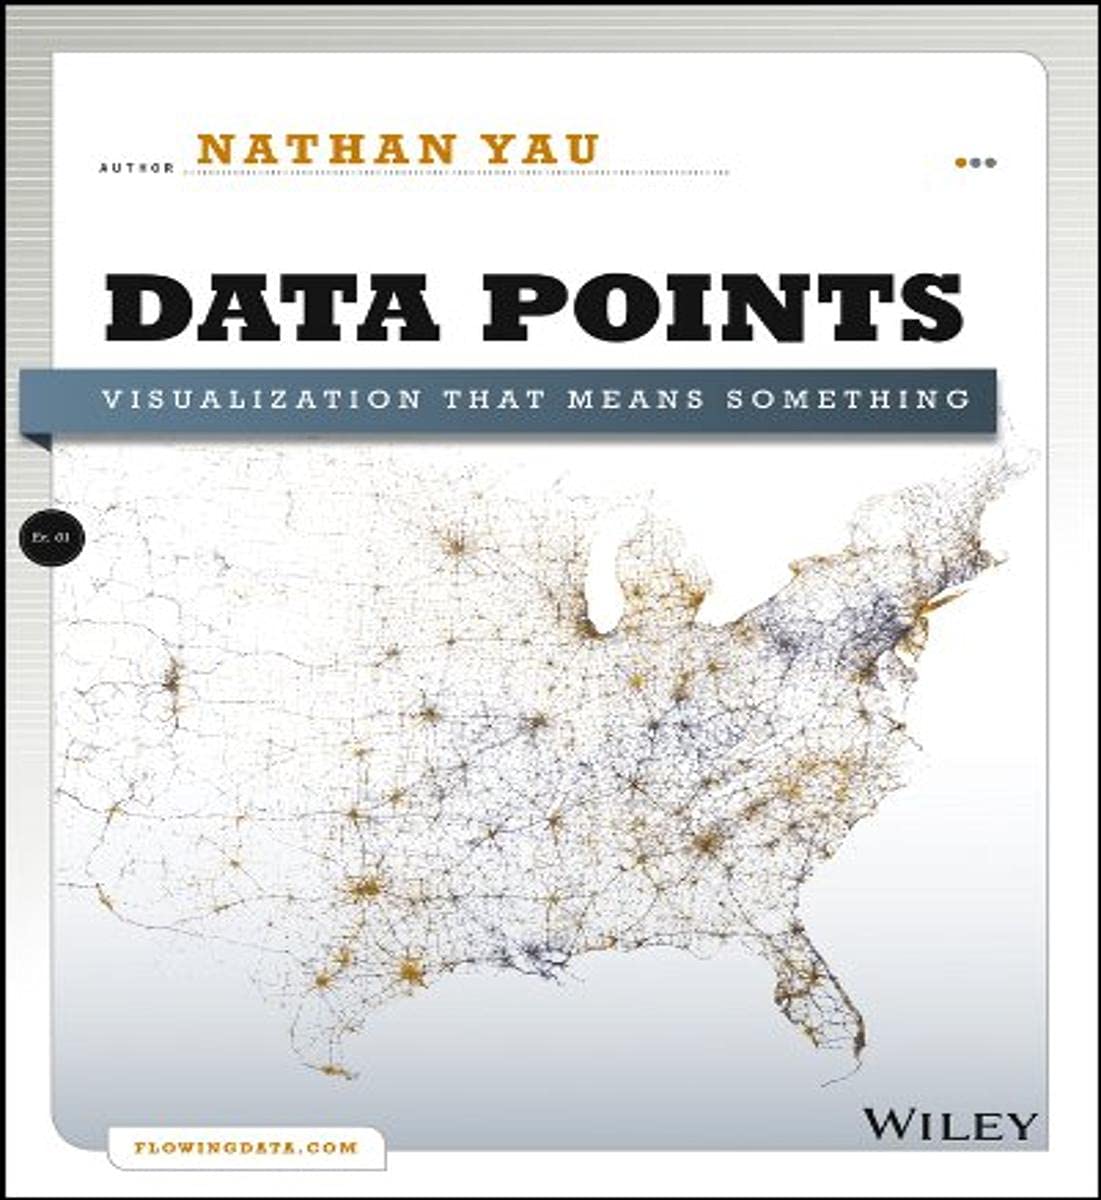
Data Points: Visualization That Means Something,New
Sold by Ergodebooks, an authorized reseller.
Returns accepted within 30 days | support@ergodebooks.com
Shipping Information
- Free Standard Shipping — United States only
- Processing Time: 3–5 business days
- Estimated Delivery: 6–10 business days after dispatch
- Double-boxed, fully insured & discreetly packaged
- Tracking number sent via email once dispatched
Returns & Refund
Returns accepted within 30 days of delivery.
Damaged or Defective Item
Free return shipping + replacement or full refund
Wrong Item Received
Free return shipping + replacement or full refund
Change of Mind
Return shipping at customer's expense · 25% restocking fee applies
Payment Option

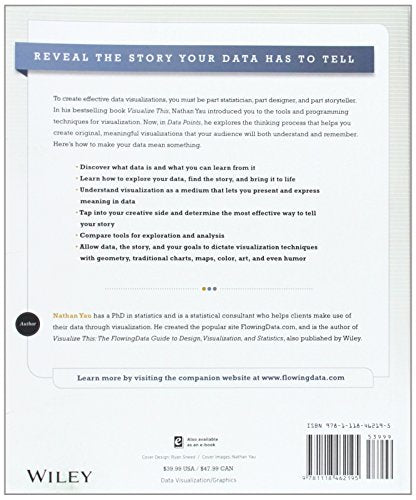
A fresh look at visualization from the author of Visualize ThisWhether it's statistical charts, geographic maps, or the snappy graphical statistics you see on your favorite news sites, the art of data graphics or visualization is fast becoming a movement of its own. In Data Points: Visualization That Means Something, author Nathan Yau presents an intriguing complement to his bestseller Visualize This, this time focusing on the graphics side of data analysis. Using examples from art, design, business, statistics, cartography, and online media, he explores both standardand not so standardconcepts and ideas about illustrating data. Shares intriguing ideas from Nathan Yau, author of Visualize This and creator of flowingdata.com, with over 66,000 subscribers Focuses on visualization, data graphics that help viewers see trends and patterns they might not otherwise see in a table Includes examples from the author's own illustrations, as well as from professionals in statistics, art, design, business, computer science, cartography, and more Examines standard rules across all visualization applications, then explores when and where you can break those rulesCreate visualizations that register at all levels, with Data Points: Visualization That Means Something.
⚠️ WARNING (California Proposition 65):
This product may contain chemicals known to the State of California to cause cancer, birth defects, or other reproductive harm.
For more information, please visit www.P65Warnings.ca.gov.