
Title
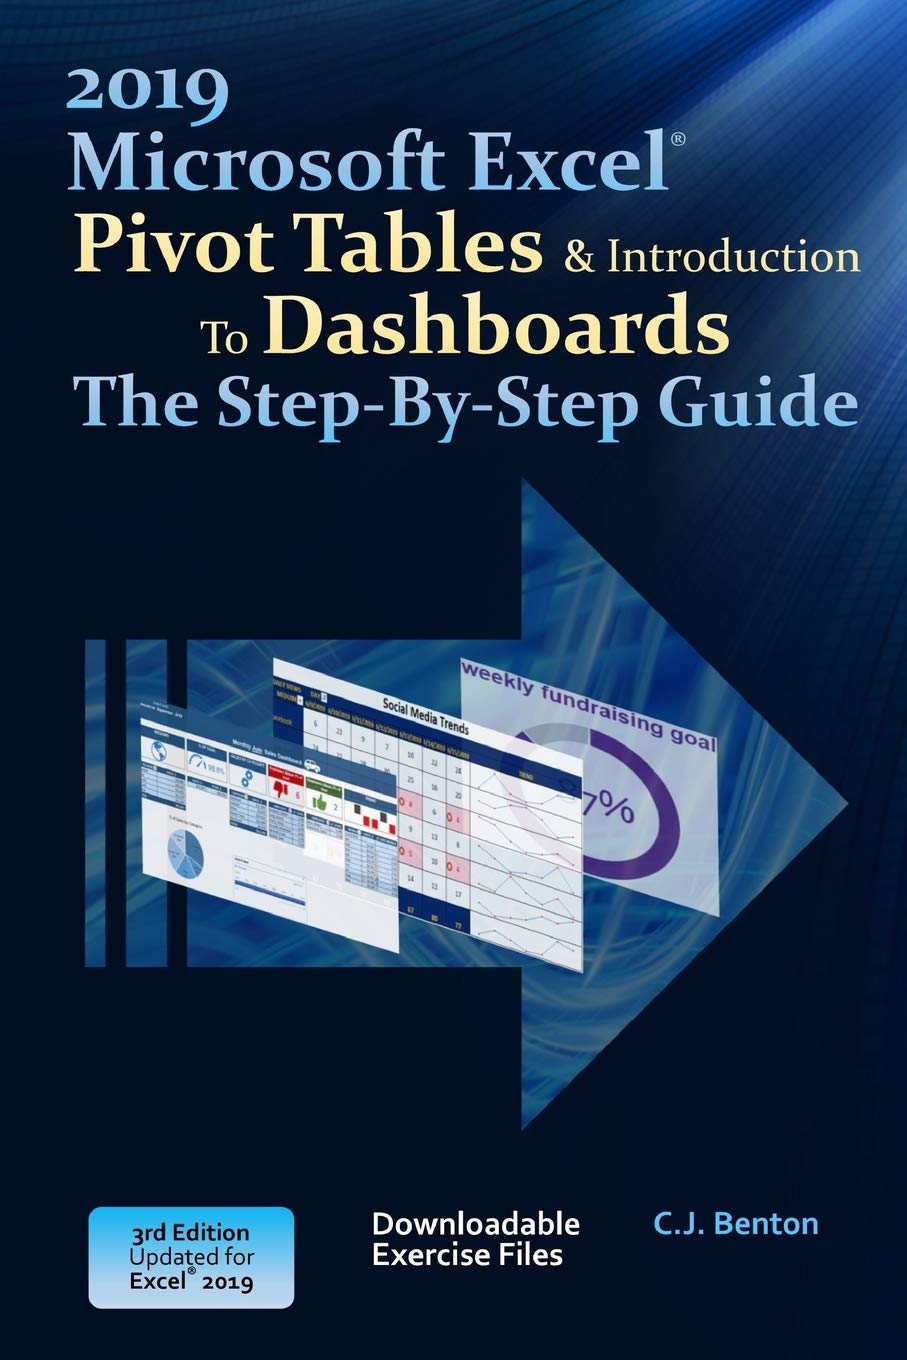
Excel 2019 Pivot Tables & Introduction To Dashboards The StepByStep Guide (The Excel 2019 StepByStep Series),Used
Sold by Ergodebooks, an authorized reseller.
Returns accepted within 30 days | support@ergodebooks.com
Shipping Information
- Free Standard Shipping — United States only
- Processing Time: 3–5 business days
- Estimated Delivery: 6–10 business days after dispatch
- Double-boxed, fully insured & discreetly packaged
- Tracking number sent via email once dispatched
Returns & Refund
Returns accepted within 30 days of delivery.
Damaged or Defective Item
Free return shipping + replacement or full refund
Wrong Item Received
Free return shipping + replacement or full refund
Change of Mind
Return shipping at customer's expense · 25% restocking fee applies
Payment Option

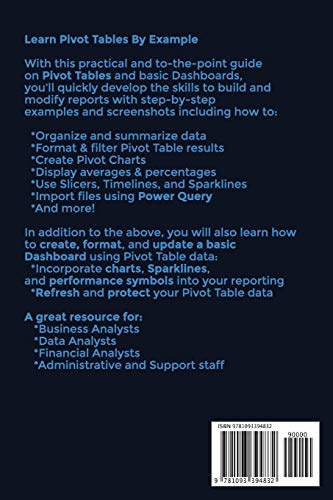
Learn Pivot Tables ~By Example~ Updated for 2019!With this practical and tothepoint guide on Pivot Tables and basic Dashboards, you'll develop the skills to build and modify reports with stepbystep examples and screenshots including how to:Organize and summarize data Format & filter Pivot Table results Create Pivot Charts Display averages & percentages Group data into predefined ranges Use Slicers, Timelines, and Sparklines Rank results Apply calculated fields Use Power Query to create and combine Pivot Table reports from imported files And more!In addition to the above, you will also learn how to create, format, and update a basic Dashboard using Pivot Table data: Incorporate Pivot Charts, Sparklines, and performance symbols into your reporting Refresh and protect your Pivot Table dataA great resource for: Business Analysts Data Analysts Financial Analysts Administrative and Support staffImagine the time you'll save by not having to search the internet or help files to learn the most practical ways of using one of Microsoft Excels best features!
⚠️ WARNING (California Proposition 65):
This product may contain chemicals known to the State of California to cause cancer, birth defects, or other reproductive harm.
For more information, please visit www.P65Warnings.ca.gov.