
Title
Interactive Visual Data Analysis (AK Peters Visualization Series),New
Sold by Ergodebooks, an authorized reseller.
Returns accepted within 30 days | support@ergodebooks.com
Shipping Information
- Free Standard Shipping — United States only
- Processing Time: 3–5 business days
- Estimated Delivery: 6–10 business days after dispatch
- Double-boxed, fully insured & discreetly packaged
- Tracking number sent via email once dispatched
Returns & Refund
Returns accepted within 30 days of delivery.
Damaged or Defective Item
Free return shipping + replacement or full refund
Wrong Item Received
Free return shipping + replacement or full refund
Change of Mind
Return shipping at customer's expense · 25% restocking fee applies
Payment Option

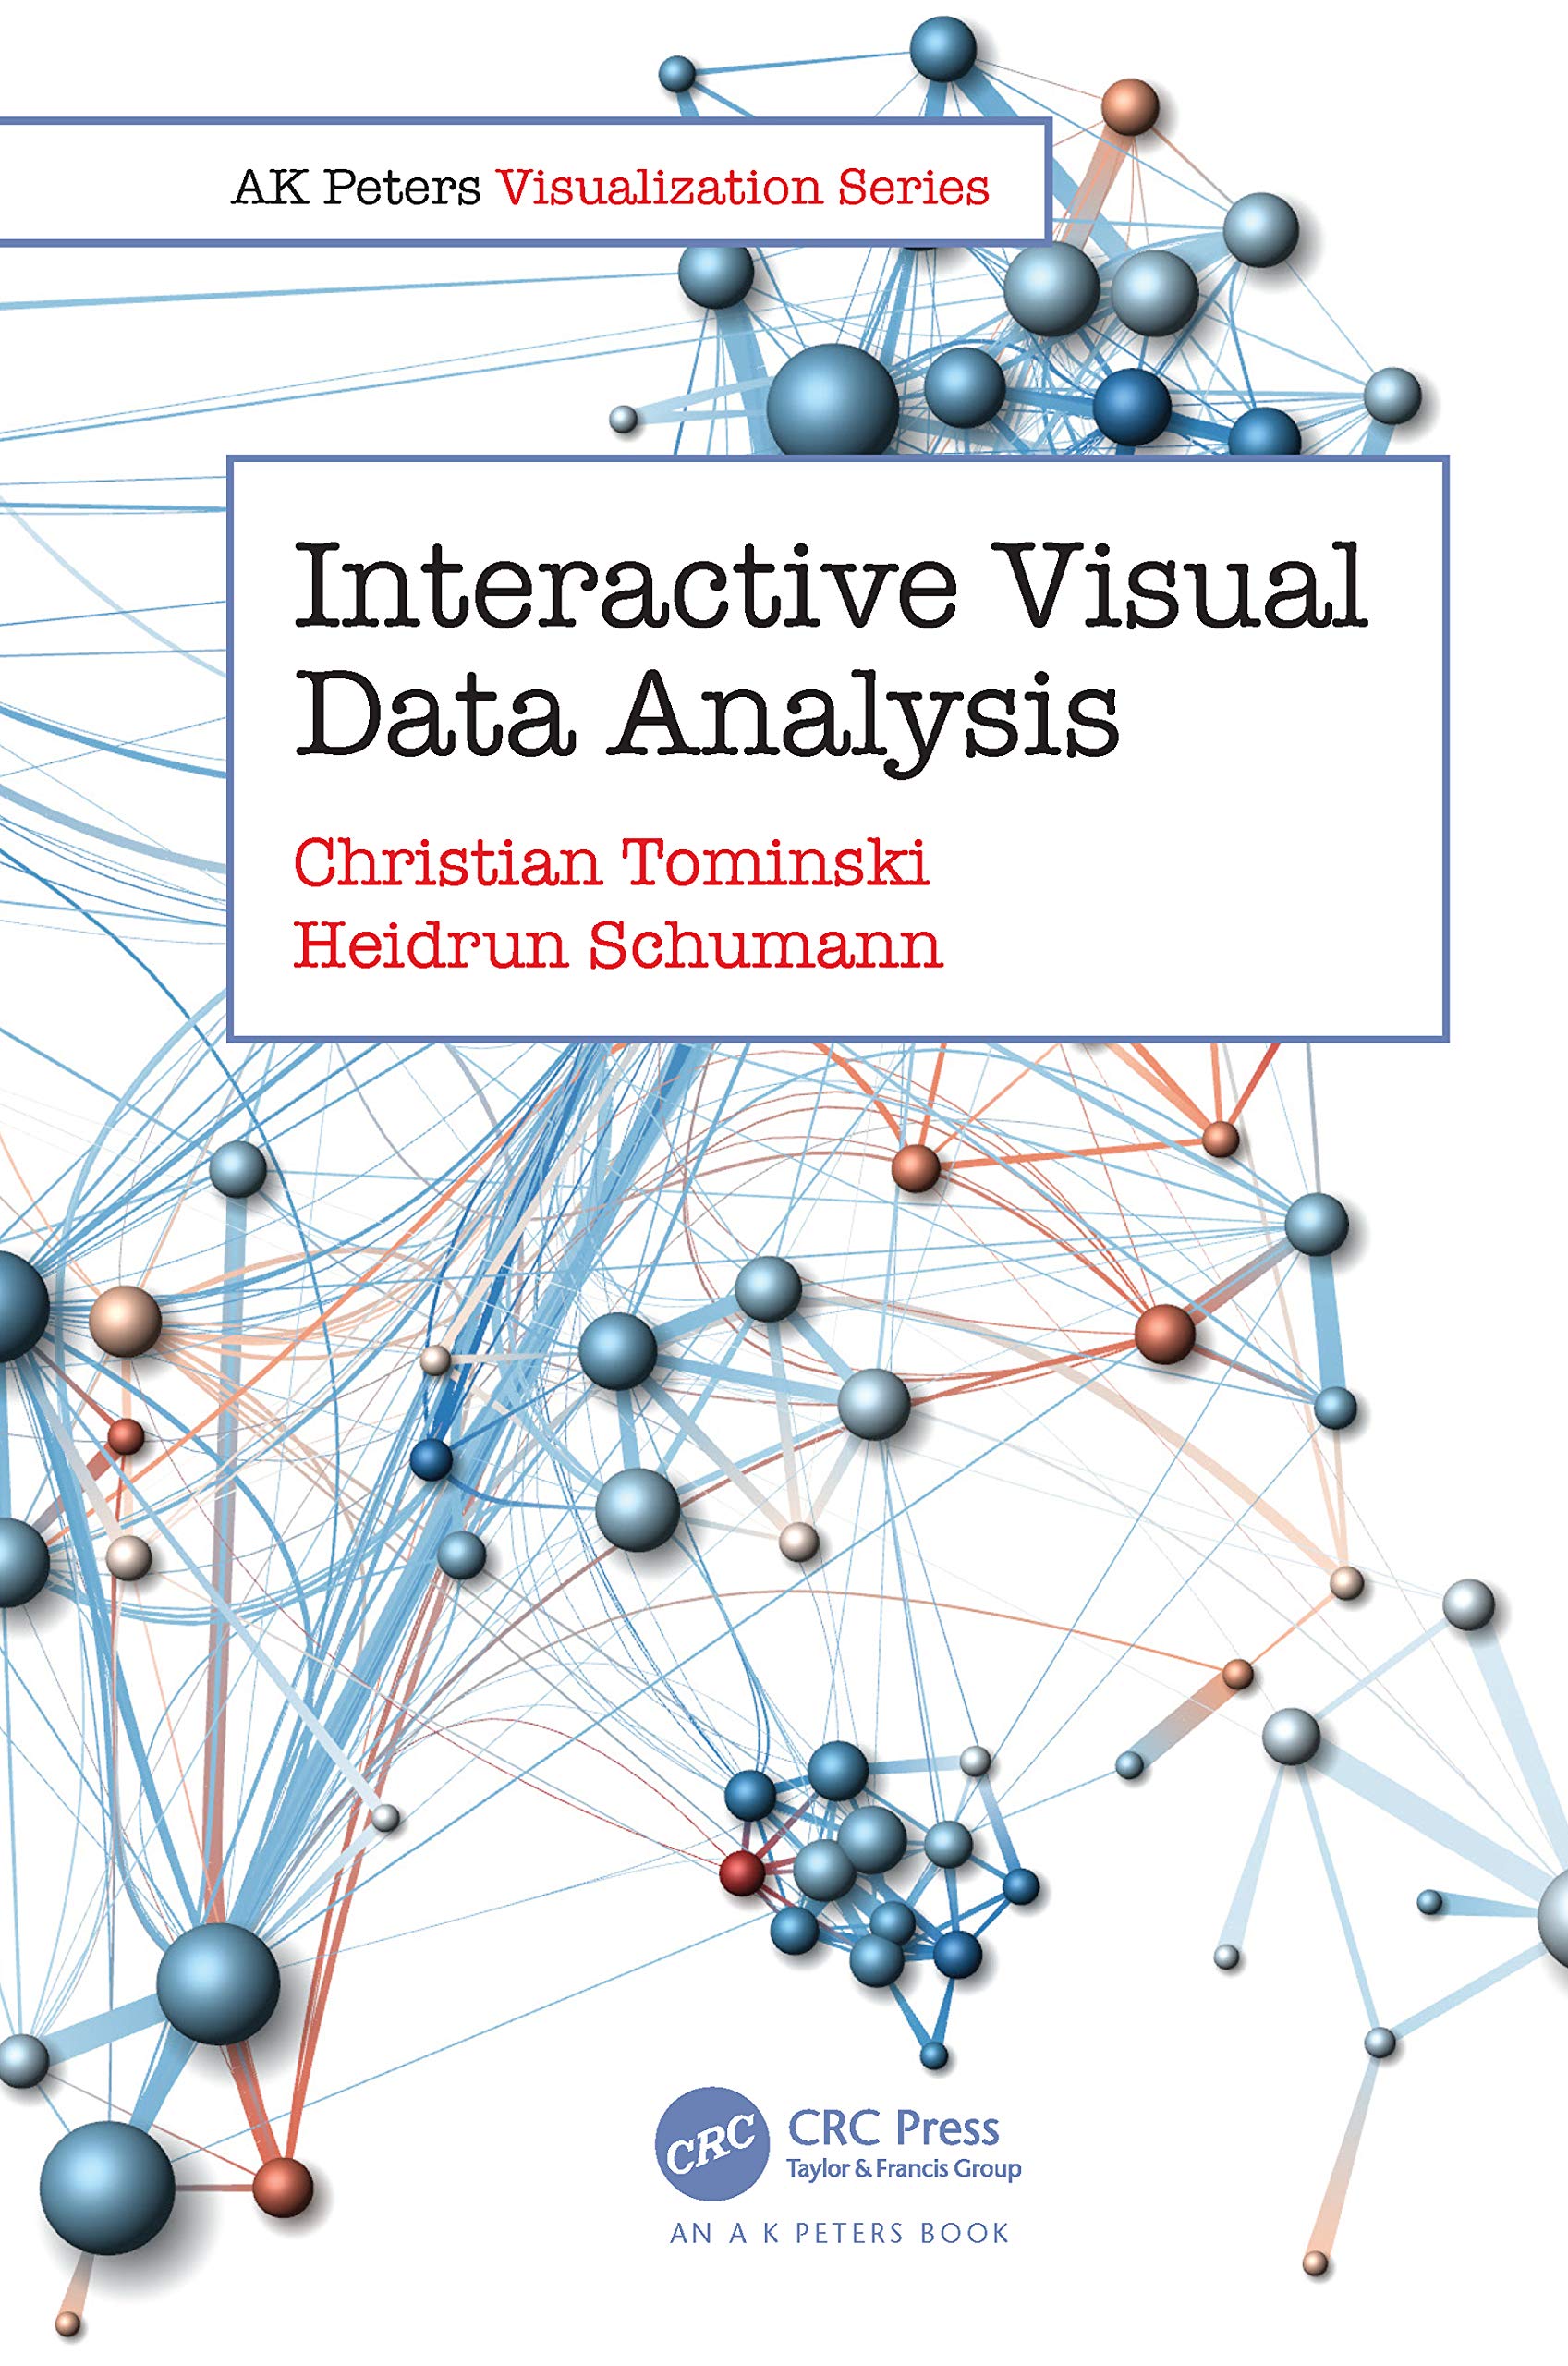
In the age of big data, being able to make sense of data is an important key to success. Interactive Visual Data Analysis advocates the synthesis of visualization, interaction, and automatic computation to facilitate insight generation and knowledge crystallization from large and complex data.The book provides a systematic and comprehensive overview of visual, interactive, and analytical methods. It introduces criteria for designing interactive visual data analysis solutions, discusses factors influencing the design, and examines the involved processes. The reader is made familiar with the basics of visual encoding and gets to know numerous visualization techniques for multivariate data, temporal data, geospatial data, and graph data. A dedicated chapter introduces general concepts for interacting with visualizations and illustrates how modern interaction technology can facilitate the visual data analysis in many ways. Addressing todays large and complex data, the book covers relevant automatic analytical computations to support the visual data analysis. The book also sheds light on advanced concepts for visualization in multidisplay environments, user guidance during the data analysis, and progressive visual data analysis.The authors present a topdown perspective on interactive visual data analysis with a focus on concise and clean terminology. Many realworld examples and rich illustrations make the book accessible to a broad interdisciplinary audience from students, to experts in the field, to practitioners in dataintensive application domains.Features: Dedicated to the synthesis of visual, interactive, and analysis methods Systematic topdown view on visualization, interaction, and automatic analysis Broad coverage of fundamental and advanced visualization techniques Comprehensive chapter on interacting with visual representations Extensive integration of automatic computational methods Accessible portrayal of cuttingedge visual analytics technology Foreword by Jack van WijkFor more information, you can also visit the author website, where the book's figures are made available under the CC BY Open Access license.
⚠️ WARNING (California Proposition 65):
This product may contain chemicals known to the State of California to cause cancer, birth defects, or other reproductive harm.
For more information, please visit www.P65Warnings.ca.gov.