

Title
Visualizing Financial Data,Used
Sold by Ergodebooks, an authorized reseller.
Returns accepted within 30 days | support@ergodebooks.com
Shipping Information
- Free Standard Shipping — United States only
- Processing Time: 3–5 business days
- Estimated Delivery: 6–10 business days after dispatch
- Double-boxed, fully insured & discreetly packaged
- Tracking number sent via email once dispatched
Returns & Refund
Returns accepted within 30 days of delivery.
Damaged or Defective Item
Free return shipping + replacement or full refund
Wrong Item Received
Free return shipping + replacement or full refund
Change of Mind
Return shipping at customer's expense · 25% restocking fee applies
Payment Option

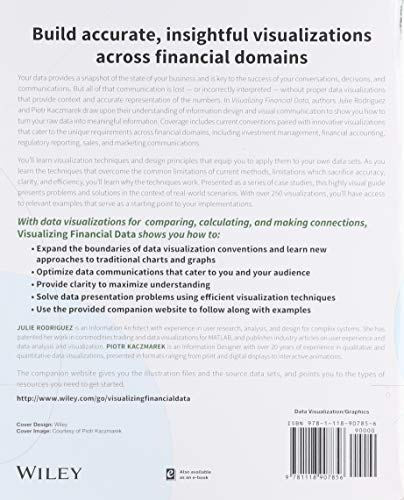
A fresh take on financial data visualization for greater accuracy and understandingYour data provides a snapshot of the state of your business and is key to the success of your conversations, decisions, and communications. But all of that communication is lost or incorrectly interpreted without proper data visualizations that provide context and accurate representation of the numbers. In Visualizing Financial Data, authors Julie Rodriguez and Piotr Kaczmarek draw upon their understanding of information design and visual communication to show you how to turn your raw data into meaningful information. Coverage includes current conventions paired with innovative visualizations that cater to the unique requirements across financial domains, including investment management, financial accounting, regulatory reporting, sales, and marketing communications.Presented as a series of case studies, this highly visual guide presents problems and solutions in the context of realworld scenarios. With over 250 visualizations, you'll have access to relevant examples that serve as a starting point to your implementations. Expand the boundaries of data visualization conventions and learn new approaches to traditional charts and graphs Optimize data communications that cater to you and your audience Provide clarity to maximize understanding Solve data presentation problems using efficient visualization techniques Use the provided companion website to follow along with examplesThe companion website gives you the illustration files and the source data sets, and points you to the types of resources you need to get started.
⚠️ WARNING (California Proposition 65):
This product may contain chemicals known to the State of California to cause cancer, birth defects, or other reproductive harm.
For more information, please visit www.P65Warnings.ca.gov.